Why use a Pareto Distribution?
You’ve figured out how to prevent defective inventory from getting out to customers. So you just test them, scrap the bad ones, and you’re done! No need to even think about it again, right?
…right?
That’s what Gary thought at first.
If you’re a regular PCat reader, you know that Gary is a former accountant who recently took his side-hustle (baking and selling delicious cookies!) full-time.

But recently he did encounter a small problem: customers were reporting that some of the cookies tasted like baking soda! And unfortunately, they were right :/
So Gary decided to implement some quality control and quality assurance measures to his manufacturing process. We won’t delve into those in this article since we’ve already covered those topics here on process cat, but basically, Gary figured out how to identify the baking-soda-tasting cookies and prevent them from getting out to customers.

And that’s definitely the first and most important step when troubleshooting manufacturing problems: containment! In other words, your first priority is to avoid having defective products get out to customers. This is especially true if there are possible health or safety implications, but even if the problem is not dangerous, bad products hurt your reputation and can also be expensive to fix now that they’ve been shipped.
Enter Root Cause Analysis. Basically, root cause analysis is a fancy way of saying “figuring out why the bad thing is happening.” And the idea with root cause analysis is that once you’ve found the cause of a defect, you’ll be able to actually prevent it instead of just catching it. And if you’re familiar with the concept of Yield, you know that means saving you time and money!
But back to the nasty cookies.
Gary noticed something unusual about the batches of cookies that tasted like baking soda: most of them also had a weird, mushy texture…

Which brings us to the next of the root cause analysis tools,
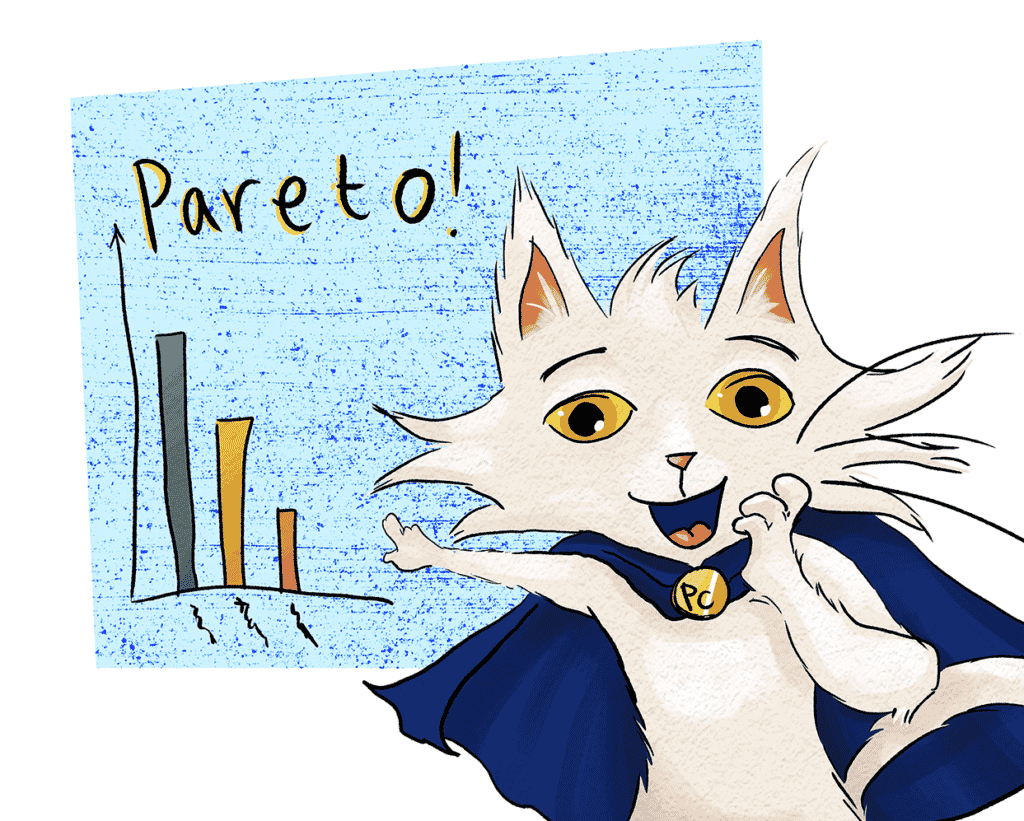
The Pareto Distribution!
The what now?
Well, let’s back up a bit. Sometimes what initally appears to be one defect that should have one root cause actually turns out to be several different defects, each with its OWN idiosyncratic root cause. Gary suspected this might be the case for his cookies, so he brought his friend Process Cat in as an extra set of eyes.
Now, this part is definitely a judgment call! You basically just look at the defective cookies (or toesocks or sunshades or pistachio-scented stickers…) and assign a label to each category.

Than, you use a tool called the Pareto Distribution to help you make some decisions.
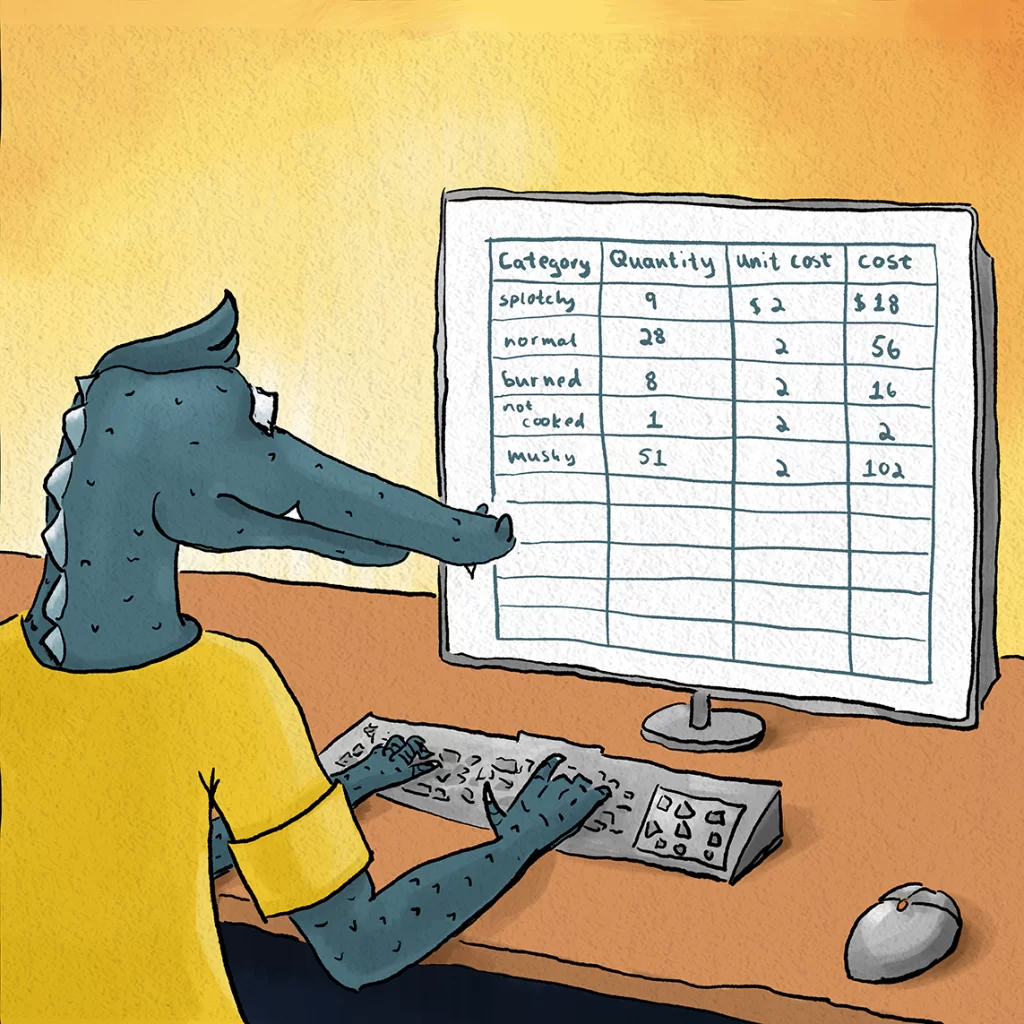
To make the Pareto Distribution, first you’ll organize your data, probably using a spreadsheet. You’ll want to list your (entirely subjective!) categories in the first column, then fill in the rest of the sheet like this:
Now you’re going to create your Pareto Distribution!
The steps will depend slightly on what type of spreadsheet software you’re using, but basically, you’re going to do this:
- Sort in descending order by column B.
- Use your software to generate a bar graph
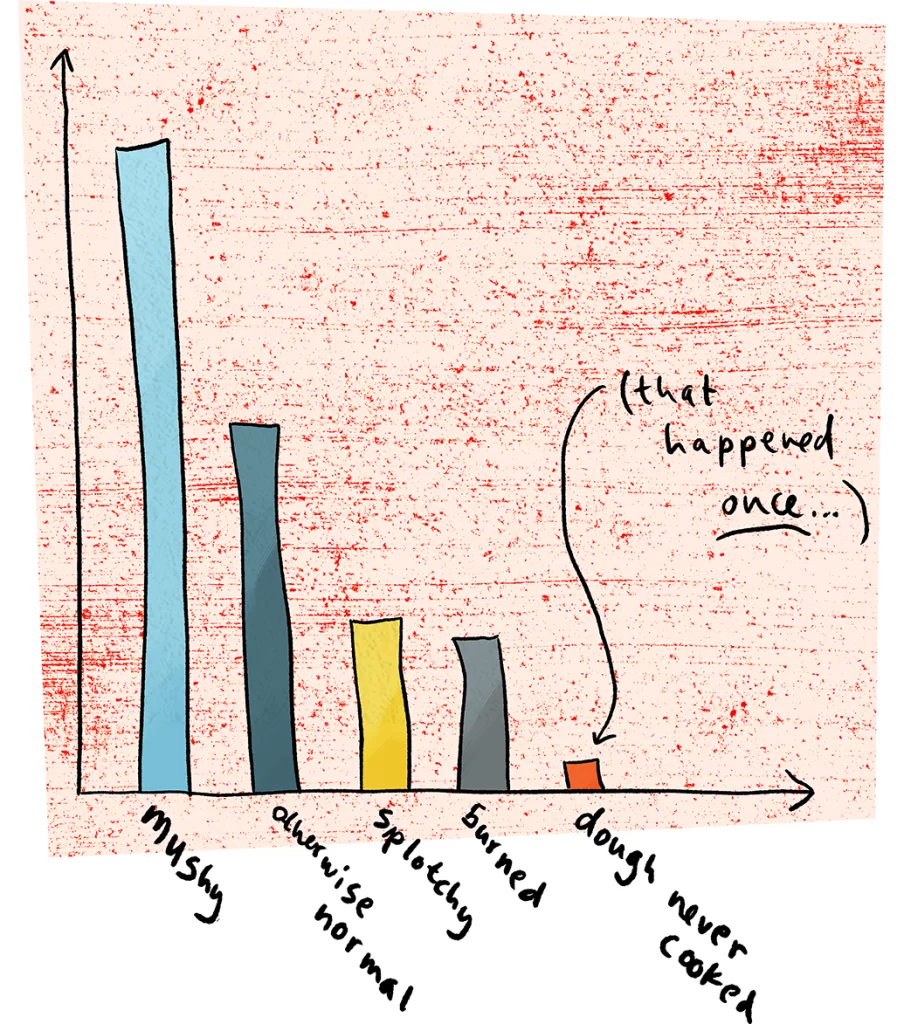
Now you know which types of defects are causing the MOST cookies to be scrapped. And you can use experiments to figure out what’s causing those and how to prevent them, while not wasting excessive resources chasing problems that occur only rarely*.

Weekly Challenge:
Try using the Pareto Distribution when troubleshooting your own manufacturing and inventory issues. You might be surprised what you find!
*Reminder: this article is only talking about defects that don’t pose any significant safety or legal problems. If you have any manufacturing defects that do cause those types of problems, you need to take them seriously no matter how rare they are!