Yes, it’s true. Ishikawa’s Fishbone Diagram is a crucial tool for any making or manufacturing business!
As a small business owner, you know that quality assurance is vital for making a good impression on your customers. And if you’re a regular PCat reader, you also know that improving your yield (reducing the number of parts you’re scrapping for quality reasons) is key to your profitability. But do you know exactly how to go about troubleshooting your manufacturing problems so you can accomplish those two things?
Gary didn’t…
You may be familiar with Gary. If you’re not? A few years ago, Gary was an accountant in his 40s who started a side business selling his home-baked cookies.
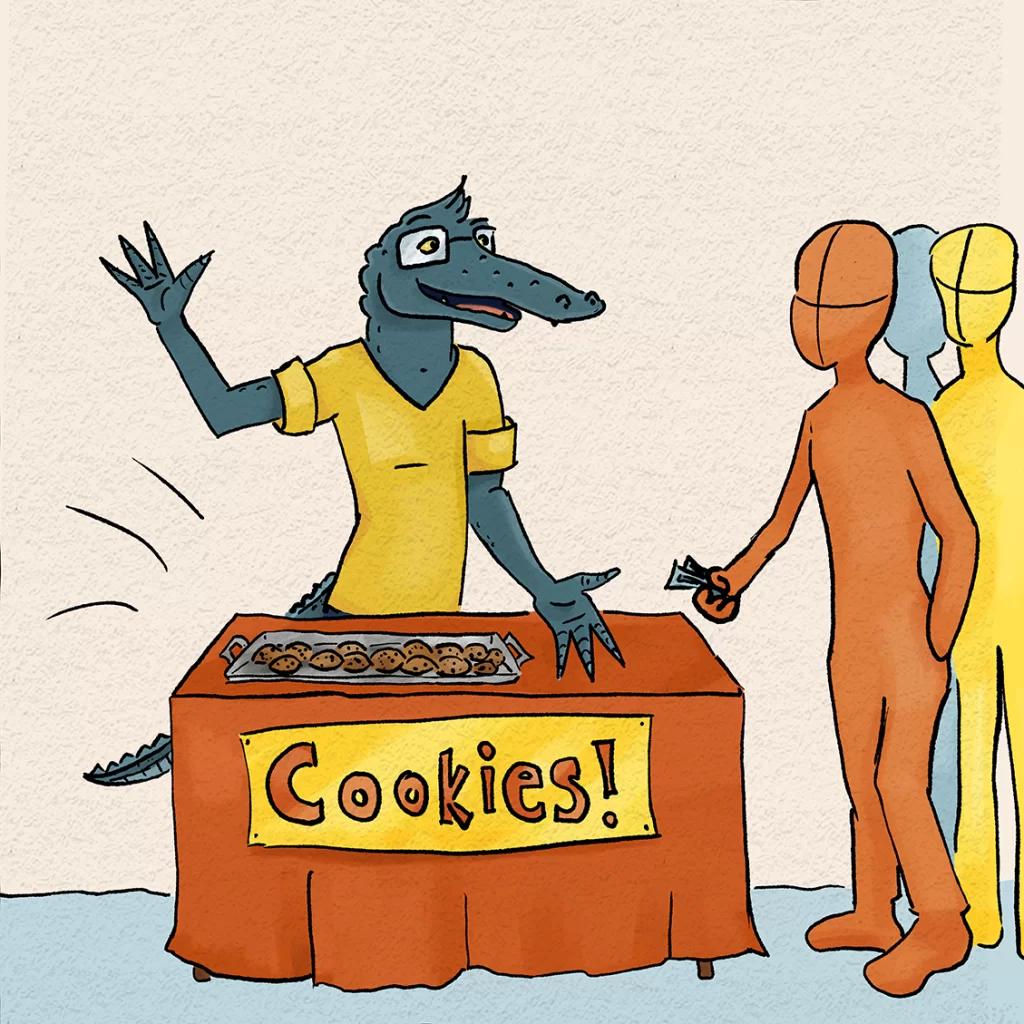
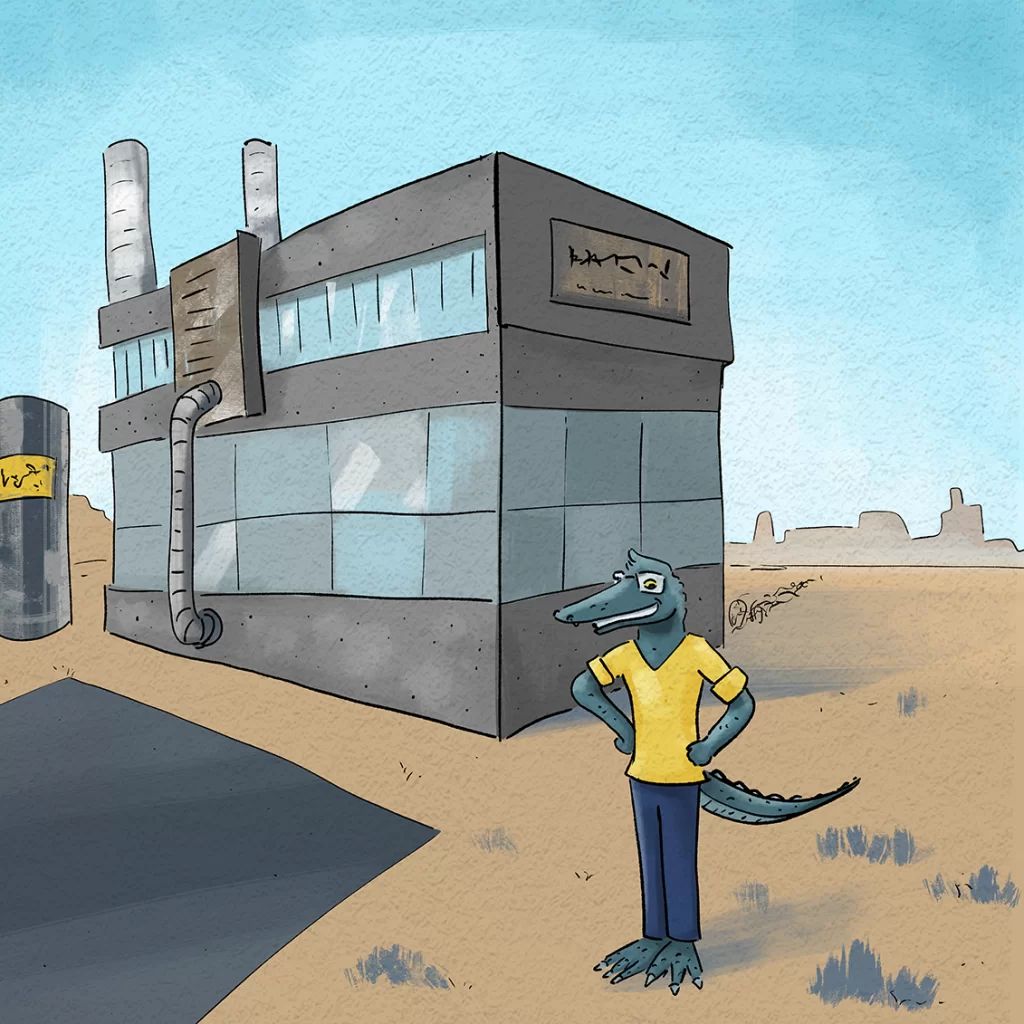
And when he unexpectedly came into some money, he decided to invest it into scaling up to a commercial bakery!
Anyway, things had been going well. But suddenly, people started reporting a problem with some of his cookies: they tasted like baking soda! And Gary had no idea why :/
Luckily, Gary’s friend Process Cat was more than happy to help him solve the problem because he was altruistic and really wanted his friend to succeed…

So Process Cat introduced Gary to…
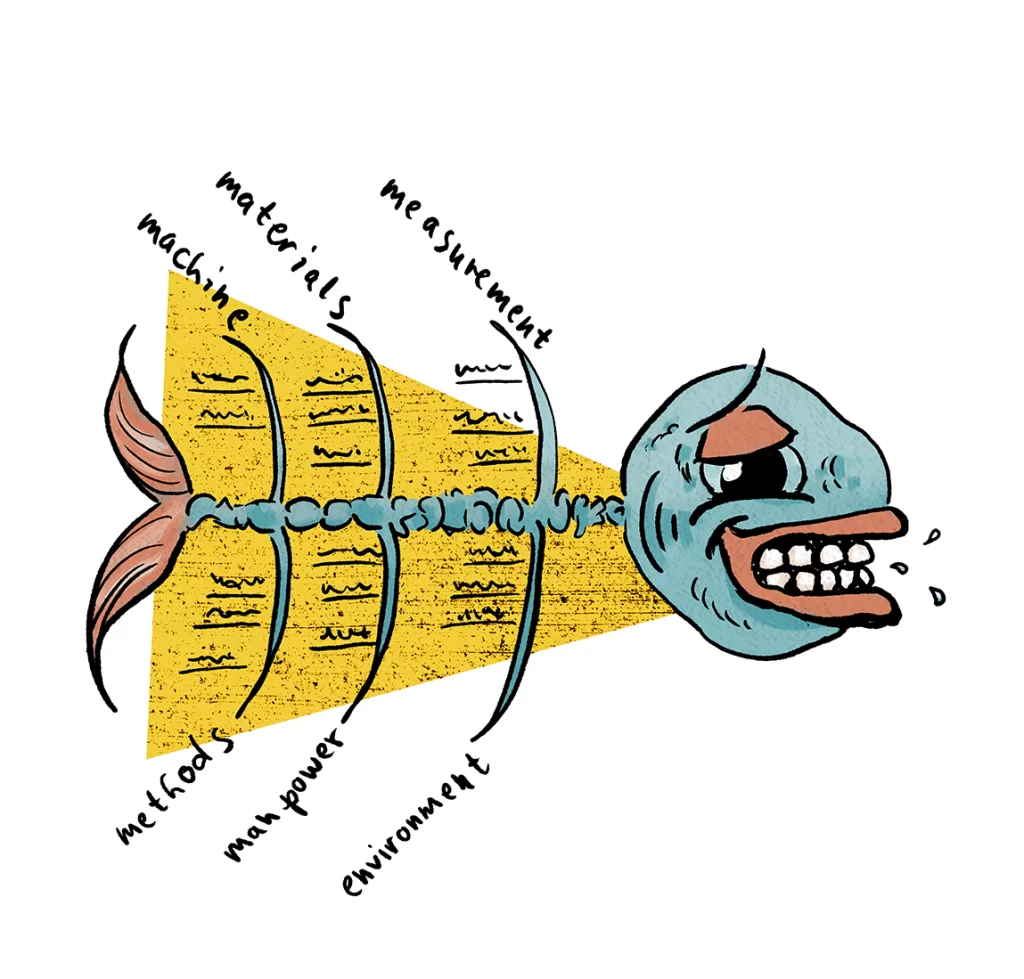
Ishikawa’s Fishbone Diagram!
The Fishbone Diagram was popularized by Kaoru Ishikawa, who was an engineering professor at the University of Tokyo in the 1960s. It’s a tool that helps you to systematically analyze the possible causes of your manufacturing defects. (It’s been applied to other situations as well, but manufacturing was the original use and probably also the one that you as a small manufacturer are most interested in!)

You’ll notice there are 6 categories of causes in the diagram. These are integral to the diagram and don’t change from situation to situation.
Categories of Causes in the Ishikawa Fishbone Diagram
- Machine
- Materials
- Measurement
- Methods
- Manpower
- Environment
The specific causes under each category, however, will be unique to your specific situation.
So how do you come up with those?
The Brainstorming Session
Ishikawa gave specific guidelines for a brainstorming session:
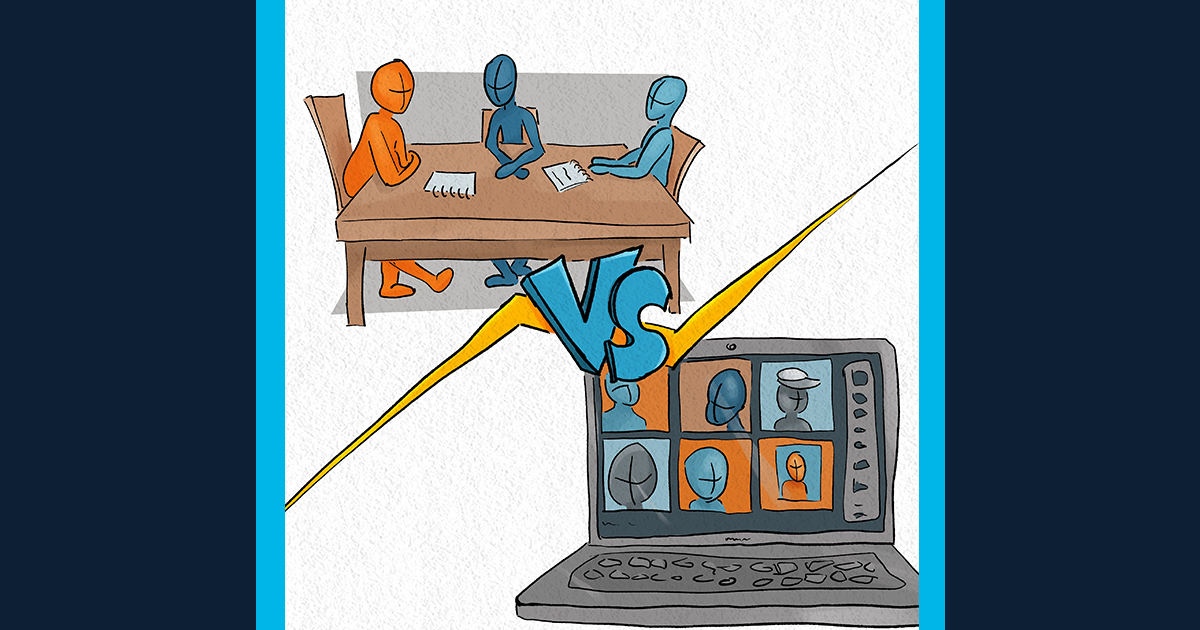
First, the team members in the session should be people familiar with the process both from a technical perspective, and how it might be affected by things like the physical environment or the business environment that it operates in. Since Gary’s friends regularly acted as his sounding boards and sometimes pitched in at the factory, they were a perfect choice for his team.
Second, the meeting facilitator should be someone who is organized and good at running efficient meetings, but who does NOT have much familiarity with the specific process being investigated.

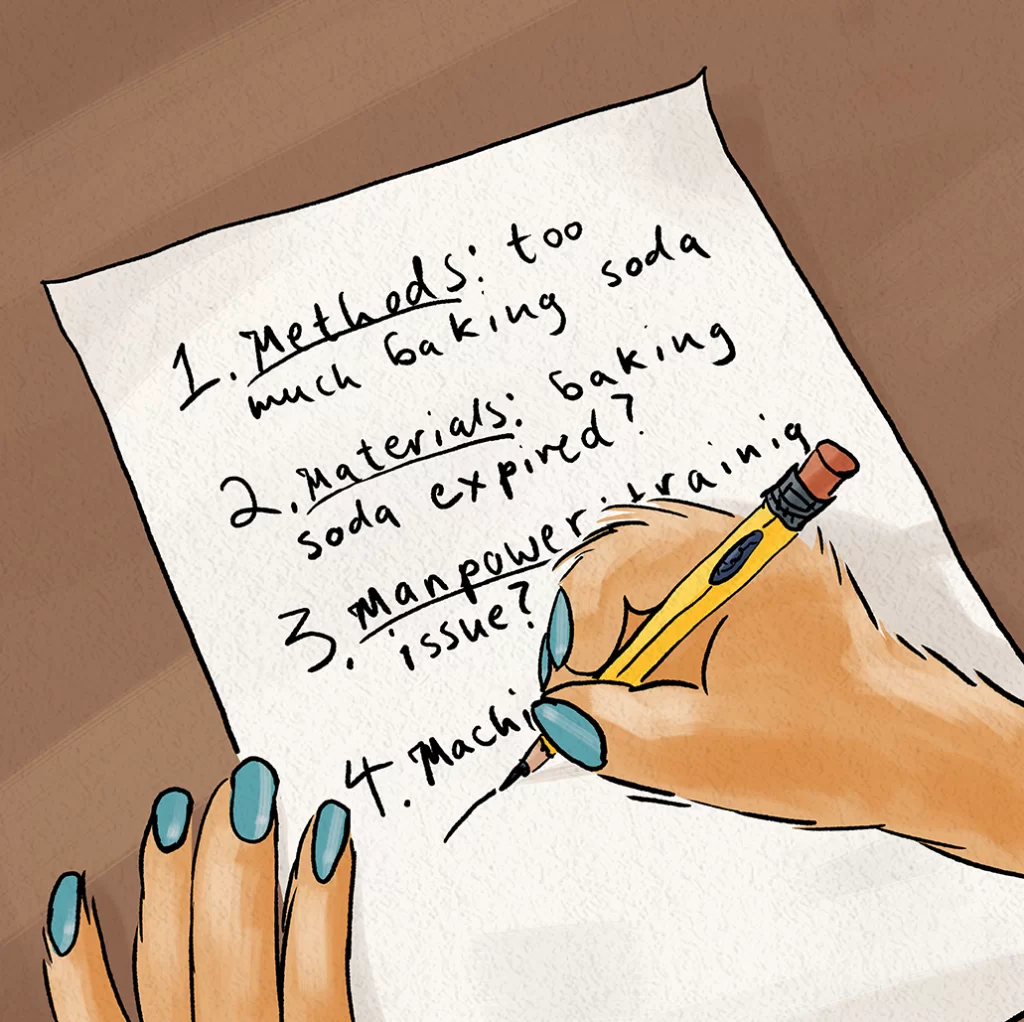
So during the brainstorming session, the team members come up with as many ideas as they can for things in each category that might be causing the problem. For example, under “methods,” they might have, “our scooping technique is giving us too much baking soda.” Under “machine,” maybe “our dishwasher is leaving a residue in the mixing bowl that tastes like baking soda.” Et Cetera.
The facilitator’s role is to simply record all the ideas and make sure everyone gets a chance to talk. (That’s why it’s better to have a facilitator removed from the situation: so they don’t come to the meeting already having their own theories about the causes or any vested interest in finding a particular result.)
After all the ideas are listed out, it’s time for…
Voting!
In this step, all of the participants rank the causes, in order of how likely they are to be the cause of the problem. Note that this part depends on informed opinion; that’s why it’s best to have people experienced with the process and situation for the team members.
Then the meeting facilitator simply tallies the votes: whichever cause gets the “lowest” score is ranked #1 by the group, then the next lowest, etc. The top (for example) 3 or 5 causes then get investigated using experiments!
Weekly Challenge:
Have a manufacturing problem you want to troubleshoot? Try formally applying the Fishbone Diagram. You’ll be surprised what you find! Come back next time to learn more about “Is-Is Not”!
Ps. Ishikawa’s Fishbone Diagram is one of a set of methods known as Root Cause Analysis. Come back next time to learn about another method that can be just as helpful!